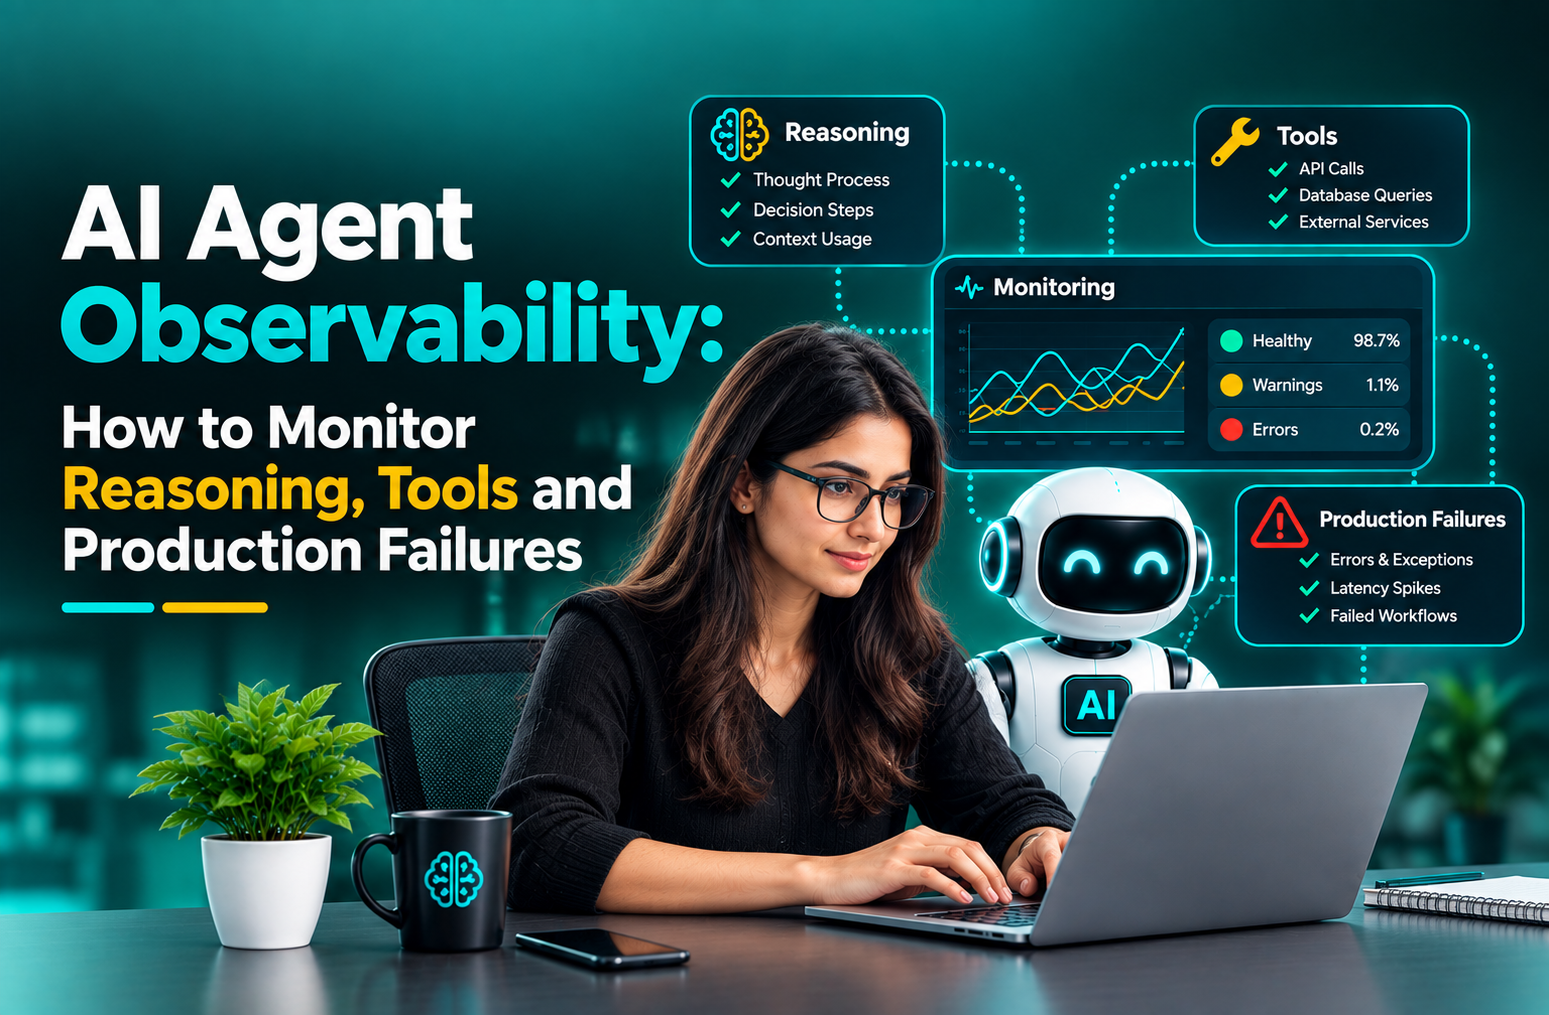
AI Agent Observability: How to Monitor Reasoning, Tools and Production Failures
Picture a customer support agent built on a large language model. It reads a ticket, looks up the order, checks the refund policy and, if everything lines up, issues a refund. For six weeks it runs without a single error in the logs. Then the finance team closes the quarter and finds that the agent approved roughly 300 refunds on orders that were outside the return window.
Nothing crashed. After a vendor update, the order lookup tool had started returning dates in a different format. The model read "03/04" as April 3 instead of March 4, and every step after that did exactly what it was told with bad input. Standard monitoring saw a healthy service. It had no way of seeing that the agent's decisions had gone wrong.
That gap is what AI agent observability is meant to close. This guide explains, in plain terms, how to watch what an agent decides, what it does with its tools, and how it breaks once real users arrive. It also covers the messy parts most overviews skip, from missing data to what happens when traffic grows tenfold.
First, what makes an agent different from a chatbot
A chatbot takes a message and returns a message. An agent takes a goal and works toward it over several steps. It decides what to do next, calls outside tools such as a search API, a database or a payment system, reads the results, and decides again. A single user request might trigger two steps or forty.
That loop is where the trouble starts. Traditional software follows the same path every time you give it the same input. An agent may take a different path on Tuesday than it did on Monday for the same question, because the underlying model picks its words by probability. Engineers call this non-deterministic. You can't test every path in advance, and the path you saw in testing may not be the one users get.
So when people talk about monitoring agents, they mean something wider than uptime and error rates. They want answers to questions like these:
• Why did the agent pick this tool and ignore the other one?
• What exact data did the tool send back, and did the agent read it correctly?
• When a user says the answer was wrong, can we replay what happened?
Observability in plain words
Monitoring tells you that something is wrong. Observability helps you work out why. A smoke alarm is monitoring. Being able to walk through the kitchen afterwards and see which pan was left on which burner is observability.
For agents, the main tool is a trace. A trace is a complete record of one request from start to finish. Inside it are spans, which are the individual steps: one span for each call to the language model, one for each tool the agent used, one for any sub-agent it handed work to. Each span stores what went in, what came out, how long it took and how many tokens it used. (Tokens are the chunks of text providers bill for, roughly three quarters of an English word each.)
There is now a shared standard for writing these records. The OpenTelemetry project, which sets the common tracing format for ordinary software, publishes conventions for generative AI. Under that scheme, a whole agent run is recorded as an invoke_agent span, each model call as a chat span, and each tool call as an execute_tool span. Because the vocabulary is shared, you can switch monitoring products later without re-instrumenting.
One caution: as of mid-2026, every attribute in these GenAI conventions still carries the "Development" stability label, so names can change between releases. Adopt it, but pin the version you use.
Where things stand in 2026
▪ In LangChain's State of Agent Engineering survey of 1,340 practitioners (late 2025), 57.3% had agents in production, up from 51% a year earlier.
▪ About 89% of respondents had some form of observability in place, rising to 94% among teams with agents already in production. Only 52.4% ran offline evaluations on test sets, and 37.3% ran online evaluations on live traffic.
▪ Quality (accuracy, consistency, hallucinations) was the most cited barrier to production, named by about a third of respondents.
▪ In June 2025, Gartner predicted that over 40% of agentic AI projects will be canceled by the end of 2027 because of rising costs, unclear business value or weak risk controls.
▪ MarketsandMarkets puts the AI agents market at USD 7.84 billion in 2025 and projects USD 52.62 billion by 2030, a compound annual growth rate of 46.3%.
Nearly everyone running agents can see what their agent did. Only about half can say whether it did the job well. For businesses paying for AI development services, the Gartner forecast is a good reason to ask how an agent will be monitored before anyone signs off on the launch date.
Layer one: watching the reasoning
Reasoning is the part people most want to see and the hardest to see honestly. Some model providers show a summary of the model's intermediate thinking, some show nothing, and you can always ask the agent to write out a plan. The OpenTelemetry conventions are clear on one point: agent spans can reconstruct the path an agent took, but they do not expose a model's private reasoning. What you get is whatever the model or your framework chooses to write down.
A written plan tells you what the agent says it intends to do. Models can write a sensible plan and then act differently, so check the plan against the actions that follow.
The most useful reasoning signals tend to be structural. You can learn a lot from the shape of a run without reading a word of it:
• Step count per request. If a task that usually takes five steps suddenly takes eighteen, the agent is probably lost, looping, or retrying something that keeps failing.
• Repeated actions. The same tool called with the same arguments three times in a row almost always means the agent didn't understand the result the first time.
• Plan changes mid-run. An agent that rewrites its plan after every tool result may be reacting to noisy data, or to instructions buried in a document it just read.
• Context size. The context window is the amount of text a model can hold in view at once. As a run grows, early instructions get pushed further back and are followed less reliably. Tracking tokens in context per step shows when a run nears that edge.
• Stop reason. Every model call ends for a reason: it finished, it hit a length limit, it asked for a tool, or a safety filter stopped it. A jump in length-limit stops is often the first sign that prompts or retrieved documents have grown too large.
Pro tip: Store the system prompt version as an attribute on every trace. When behavior shifts, the first question is always "what changed?", and a prompt edit that nobody wrote down is the most common answer.
Once you capture reasoning text, you can score it. A popular approach is to use a second model as a judge. The judge reads the trace and grades whether each step followed sensibly from the last. It's cheap and scales well, though judges have blind spots of their own (more on that below).
Layer two: watching the tools
Tools are where an agent touches the real world, so this is where the expensive mistakes happen.
For each tool call you want five things on record: which tool was chosen, the arguments the agent passed, the raw result that came back, how long the call took, and whether it failed. The execute_tool span records tool name, duration and error type by default. Prompts, completions and tool arguments are not captured by default, because they so often contain customer data. Switching content capture on is a deliberate choice, which forces a privacy conversation first.
The failures here are rarely clean errors. Here is roughly what one trace from the refund story would look like:
Step
Span
What actually happened
What the dashboard showed
1
invoke_agent refund_agent
Customer asks for a refund on order #88412
Request received
2
chat
Model plans: look up order, check policy, decide
1.1 s, 900 tokens
3
execute_tool get_order
Tool returns purchase date "03/04/2026"
Success, 180 ms
4
chat
Model reads the date as April 3, inside the 30-day window
0.9 s, 1,400 tokens
5
execute_tool check_policy
Confirms the 30-day return window applies
Success, 95 ms
6
execute_tool issue_refund
Refund of $129 is issued
Success, 310 ms
7
chat
Agent tells the customer the refund is on its way
0.7 s, 600 tokens
One run of the refund agent, reconstructed from its trace. Every step reports success.
Every span is green. The mistake lives in the gap between step 3 and step 4, in how the model interpreted a value. You only catch it if you keep the raw tool output and check it, either with a plain rule (dates must arrive in the ISO format, 2026-03-04) or with an evaluator that compares the facts the agent states against what the tool actually returned.
Other tool problems that look perfectly healthy on an ordinary dashboard:
• Empty results. A search tool that finds zero documents still returns a success code. The agent then answers from general knowledge, which may be stale or invented.
• Truncated results. Some tools cut long responses at a fixed length. The agent sees half a table and draws conclusions from it.
• The wrong tool with a valid call. The agent calls get_customer when it needed get_order. Both succeed; the answer is still wrong.
• Schema drift. The tool's owner renames a field. The agent keeps running and quietly reads empty values.
• Injected instructions. A web page or email the agent reads contains text such as "ignore previous instructions." This is called prompt injection. The trace is often the only place that shows which document it came from.
If your agent connects to outside tools through the Model Context Protocol (MCP), a common standard for plugging tools into agents, the GenAI conventions now cover those calls too, so they sit in the same trace as the agent that made them.
Pro tip: Add a cheap sanity check to every tool span: the length of the result, the number of items returned, and whether the required fields are present. These cost almost nothing and catch empty or truncated results early.
Layer three: catching production failures
Production is where the first two layers earn their keep. Failures in live systems fall into a few rough groups, and each group needs a different response.
Loud failures
These are the ones you already know how to catch: timeouts, rate-limit errors from the model provider, tools that throw exceptions, responses your code can't parse. Standard alerting works. The agent-specific twist is that a loud failure at step 12 of a 15-step run wastes every token spent on steps 1 through 11, so the cost of an error depends on where in the run it happens.
Quiet failures
The agent finishes, returns a confident answer, and is wrong. The refund case is a quiet failure. So is an answer citing a policy retired last month. A confidently wrong run can produce the same telemetry as a correct one: similar token counts, similar latency, the same successful spans. Raw telemetry carries no field for correctness. You add that signal yourself through evaluations, user feedback or expert spot checks.
Teams running production AI applications usually find that quiet and slow failures cause most of the real damage, while loud failures soak up most of the engineering attention because they are the easiest to see.
Slow failures
Some problems build over weeks. Providers update models. Search starts surfacing older documents. Average steps per task creep from six to nine. Cost per conversation rises 40% with no single change to blame. None of this trips an alert on any given day.
Data teams have a name for this: drift. Groups that already run MLOps servicesfor traditional machine learning models will recognize the pattern, since the fix is similar. (MLOps is the practice of deploying, watching and maintaining machine learning systems once they are live.) Chart a few numbers weekly, and rerun a fixed test set whenever a model, prompt or tool changes.
How the three layers compare
Each layer answers a different question, and each leaves something out. Reasoning records show what the agent planned without showing what it received. Tool records show what happened without showing why the agent chose it. Production metrics tell you quality dropped and give you nowhere to start looking. Together, they take you from "cost rose this week" to the exact span that went wrong.
Reasoning
Tools
Production failures
Main question
Why did the agent decide this?
What did the agent do, and what came back?
Is the agent working for real users right now?
What you record
Plans, step count, context size, stop reasons
Tool name, arguments, raw result, latency, error type
Success rate, cost per task, feedback, scores over time
Typical warning sign
Step count jumps, repeated actions, constant plan rewrites
Empty or cut-off results, wrong tool, renamed fields
Rising cost per task, falling scores, more handoffs to humans
Best way to check
Model judge plus human review
Rule checks on outputs
Weekly trend review
Blind spot
Cannot see the model's private reasoning
Can't tell if the agent used the result correctly
Shows that something broke, not where
Privacy risk
Medium
High (customer data in arguments)
Low (mostly totals)
Storage cost
High (long text)
Medium to high
Low
The three layers side by side.
The hard parts that feature pages leave out
Most tools in this space demo well on a single, tidy trace. The real problems show up when data is incomplete, when signals disagree, when a check can't wait and when volume climbs. That is where most of the design work in AI agent observability goes.
Data gaps
You will never have a complete picture. The biggest gap is usually on purpose. Many teams keep prompt and tool content out of traces to protect personal data, which leaves them with timings and token counts and no text to debug with. A middle path is to mask emails, card numbers and names before the span leaves your servers, and keep full content only for a sample or for runs users flag.
Sampling creates the next gap. At high volume, storing every trace gets expensive, so teams keep a percentage. Random sampling at 5% means a failure that hits one run in a thousand may show up in stored data once a week, or not at all. Tail-based sampling fixes much of this. The system decides after a trace finishes: keep every trace with an error, a high step count, an odd cost or negative feedback, and sample the ordinary ones.
Outside tools are another blind spot. When your agent calls a third-party API, you see the request and the response and nothing in between. A vendor serving stale cached data looks like a fast, successful call. Recording the vendor's response timestamp or version header, where one exists, gives you something to check against.
Background jobs break traces too. If the agent drops a job onto a queue and a worker picks it up later, the link between the two is lost unless the trace ID travels with the job. It's a small change that is easy to forget.
Conflicting signals
Sooner or later your signals will disagree. Decide in advance which one to trust, before an outage forces the question.
When this happens
What is usually going on
What to trust
User gave a thumbs up; evaluator marked the answer wrong
Users rate tone and speed. They can't always spot an outdated policy.
The evaluator, once a person has confirmed a sample
Evaluation scores dropped; support tickets stayed flat
The evaluator changed, or the test set no longer matches real traffic.
Neither yet. Rerun old traces through the evaluator first.
Latency is normal; cost per task keeps rising
More steps or more context per run, while each call stays quick.
The cost trend. Check step counts.
Model judge and human reviewer disagree
Judges favor long, confident answers and may share the agent's blind spots.
The human, until 100 to 200 labeled traces show how often the judge agrees
Tool reports success; agent says it failed
The agent misread the result, or an error message sat inside a success response.
The raw tool output
Common signal conflicts and how teams usually resolve them.
A signal is only as reliable as whatever produces it, so evaluators and feedback buttons need occasional checks too.
Real-time decisions
Some checks can wait for a daily report. Others must run while the agent works. The dividing line is usually reversibility. If an action can be undone cheaply, such as drafting a reply or suggesting a product, it's fine to evaluate it afterwards and fix patterns over time. If it can't, such as moving money or deleting records, the check must sit in front of the action.
Inline checks have a time budget. A model-based check can add a second or more, so order matters:
• Run fast rule checks first. Validate formats, amounts and IDs with plain code, which takes microseconds. In the refund case, a single rule rejecting ambiguous date formats would have stopped the whole incident.
• Route high-risk actions to a person. Refunds above a set amount, or any action on an account flagged as sensitive, pause for human approval.
• Use circuit breakers. If a tool's error rate passes a limit over the last few minutes, stop calling it and fall back to a safe response.
• Cap steps and spend per run. A hard ceiling on steps and tokens stops a looping agent from burning through your budget at 3 a.m.
Record each of these decisions in the trace. Knowing which rule fired, and what the agent tried, lets you tell useful blocks from false alarms. Guardrails are often cut when budgets tighten, so if you pay forAI development services, check they are listed as deliverables.
Exceptions and edge cases
Retries can repeat side effects. If a payment call times out and the agent tries again, did the first one go through? Without idempotency keys (a unique ID attached to each action so the receiving system can ignore duplicates), a retry can charge a customer twice. The trace should show both attempts and the key they shared.
Runs can stop halfway. An agent that completes four of six steps before failing leaves things in a half-changed state. Record which side effects succeeded so someone knows what to undo.
The model can change under you. Providers sometimes update the model behind a name you use. Record the exact model identifier returned in each response, which OpenTelemetry stores separately from the model you requested, so you can match behavior changes to version changes.
Inputs vary more than test sets suggest. An agent tuned on English tickets may behave differently on Tamil or Spanish ones, or on messages full of screenshots. Tag traces with language and input type, because averages hide these differences.
Long conversations carry old mistakes forward. A problem in turn 25 often traces back to turn 3, so give every trace in a session a shared session ID.
Behavior under pressure and at scale
Agents behave differently when traffic climbs. Model APIs limit how many requests and tokens you can send per minute. Under load, some calls get rejected, the agent framework retries them, and the retries add more load. This retry storm can turn a short spike into a long slowdown. Show retries as separate spans with a reason attached, so you can tell a slow model from a throttled one.
Peak hours also bring harder, more varied requests, so cost per task at peak can sit well above the average. That matters when you set spending limits forproduction AI applications with thousands of daily users.
Then there is the telemetry. One agent run can produce dozens or hundreds of spans. At a hundred thousand runs a day, trace storage becomes a real line on the cloud bill.
Watch cardinality too, meaning the number of distinct values a field can take. Tagging metrics with user IDs creates millions of combinations. Keep those details on traces, and use a few labels on metrics, such as agent, tool and model version.
Multi-agent setups stretch all of this further. When one agent hands work to another, the parent trace ID has to be passed along so the whole chain appears as one tree. Problems like these separate people who have run agents from people who have only demoed them, which is worth keeping in mind when you hire AI developers for agent work.
Pro tip: Load test the monitoring stack along with the agent. Tracing exporters often drop spans silently when their buffers fill during a spike.
A practical starting plan
You don't need all of this on day one. A workable order for small teams:
1. Instrument with OpenTelemetry-compatible tracing from the start, even if the data only goes to a free or self-hosted backend. Langfuse and Arize Phoenix are open-source options, while LangSmith, Braintrust and Datadog offer hosted products.
2. Record the prompt version, exact model identifier, tool names and redacted raw tool outputs on every trace.
3. Add hard caps on steps and spend per run, plus plain rule checks on any tool that moves money or changes data.
4. Pick a short list of numbers to review weekly: task success rate, cost per task, average steps, tool error rate, handoffs to humans and the rate of negative feedback.
5. Build an evaluation set from real failures. Each time a trace shows a bad outcome, add it to a test set so the next prompt or model change is checked against it. Regression testing like this is routine in MLOps services for classic models, yet only about half of agent teams do it.
6. Read a random sample of traces by hand every week. Twenty careful reads teach more than a dashboard.
With that base in place, add model-based evaluators, online evaluation of live traffic and tail-based sampling as your volume grows.
Building it in-house or bringing in help
Installing a tracing library is the easy part. The harder work is deciding what counts as a failure for your particular business, writing evaluators that match that definition, and keeping the whole setup accurate as models, prompts and tools change underneath it. That ongoing work resembles what MLOps services teams already do for machine learning models, which is why they often end up owning agent monitoring too.
If your team has strong backend engineers but little hands-on experience with language models, the weak spot is usually evaluation design and knowing which failure modes to expect. That's a sensible point to bring in outside AI development services for the first build, with a clear handover so your own people own the system afterwards.
When you speak with an AI development company about agent work, ask how they monitor the agents they have already shipped. Ask about their sampling rules, how they redact customer data, and how they found their last few production incidents. A polished demo with no incident stories usually means little time in production.
Some companies would ratherhire AI developers directly and grow the skills in-house. If you go that way, look for people who have debugged an agent after launch.
What to remember
▪ Agents fail quietly far more often than they fail loudly. A green dashboard says the service is up, and says nothing about whether its decisions were right.
▪ Keep the raw tool outputs. Many costly agent mistakes begin with the agent misreading data that looked fine.
▪ Treat an agent's written reasoning as its own account of itself, and check it against what it actually did.
▪ Put fast, rule-based checks in front of any action you can't undo.
▪ Check your evaluators as often as you check your agent.
Where this leaves you
An agent is software that makes choices, and you can't manage choices you can't see. AI agent observability gives you a way to see them: a trace for every run, a record of every tool call, and a short list of numbers you watch over time. The refund agent at the start would have been caught by one rule on a date field, or by anyone reading a few of its traces in week one.
If you are planning your first agent, build the tracing in before launch. If agents are already live, start with sampling rules and a weekly trace review. And if an outside AI development companyis building the agent for you, make monitoring part of the scope from the first conversation. It is much harder to add after an incident.
Ayush, the visionary Director leading our team towards new horizons. With a passion for innovation and a keen eye for opportunities, Ayush drives our company's growth with unwavering determination. His strategic thinking and empathetic leadership inspire us all to achieve greatness together.
Frequently Asked Questions
Regular monitoring tracks whether a service is up, fast and free of errors. AI agent observability adds a record of decisions: which tools the agent picked, what data came back, how the agent interpreted it and whether the final result was correct. An agent can pass every health check and still give wrong answers.
Only partly. Tracing records the path the agent took, including every model call and tool call, but it doesn't reveal the model's private internal reasoning. Some models output a plan or summary you can store. Compare that text with its actions, since the two don't always match.
Costs come from two places: storing traces and running evaluations. Tail-based sampling, short retention for raw text and running model judges on a sample of runs keep both under control. If an AI development company is hosting the stack for you, ask how trace storage and evaluator calls are billed before you sign.
Small teams need it too. Even a single agent with a few hundred users benefits from basic tracing, because a quiet failure is far cheaper to catch in week one than in month three. Startups building production AI applications can begin with an open-source tracer, a cap on steps per run and a weekly trace review, and add evaluators later.
Look for people who have kept an agent running after launch. Building one is the easier half of the job. Good signs include tracing experience, a clear view on retries and idempotency, and a habit of turning failures into test cases. When you hire AI developers for this work, ask them to walk you through a production incident they debugged and the change they made afterwards.
Find exceptional developers at Hourlydeveloper. Get the expertise, solutions, and teamwork you need for success. Hire developers easily and boost your projects today!
 Back to Blog